The Original Gay Porn Community - Free Gay Movies and Photos, Gay Porn Site Reviews and Adult Gay Forums

  • Welcome To Just Us Boys - The World's Largest Gay Message Board Community

    In order to comply with recent US Supreme Court rulings regarding adult content, we will be making changes in the future to require that you log into your account to view adult content on the site.
    If you do not have an account, please register.
    REGISTER HERE - 100% FREE / We Will Never Sell Your Info

    To register, turn off your VPN; you can re-enable the VPN after registration. You must maintain an active email address on your account: disposable email addresses cannot be used to register.

  • Hi Guest - Did you know?
    Hot Topics is a Safe for Work (SFW) forum.

On Topic Discussion 2019 Coronavirus (COVID-19/SARS-CoV-2)

Exactly. Unless the person looking at the chart is astute enough to notice that the dates are not in order, it's easy to assume that the deaths are decreasing daily.

The chart itself is something that a high school kid would get an "F" for. The top of the chart talks about "counties with most cases" but the chart says that the bar graph is "deaths and hospitalizations"? I only see 1 bar per county, so is this deaths? It is hospitalizations?

Also notice that the position of the county bars keeps changing in position, so that it's hard to follow the trends for any particular county. Fulton County (where Atlanta is located) is gold but sometimes it's in a different position on each day.

And why did they chose these 5 counties instead of presenting the state as a whole? For example, one of the worst hit counties in Georgia was Dougherty County- they have a population of about 88,000 but they have 1,626 cases and 128 deaths.

Even my ADD disorder noticed that everything has been arranged to show all bars and colours giving the impression of a decreasing order.

Again, the Western world has fallen in such a sticky predicament, because even the self-proclaimed "critics" in all nations are just as muddled-headed and as unwilling to face the fact that disease and death is rambling wild in the healthy Western world, and that the choice of the governments can make about going out or staying home are actually the choice that their own peoples will actually make on their own and, most important, that there is no "golden middle" in which you will find more or less people dying or going bankrupt. It is the same silly contradiction that would pretend to gain capital growth with no real, with a "minimum" risk: if you do not take it, you will just have to find some sort of financial contraption to have others take it for you.

That "golden middle" some fancy and are desperately seeking didn't exist before the pandemic, and it is no different now, and it is only a desperate movement to try to ignore the toughness and risks that you took for granted before the crisis, because there was a dynamics in motion whose inertia made the choices for you already, so you did not need to care whether you should rather save lifes or businesses: they just kept falling with the same unnoticeable yet unavoidable force that makes you unaware of the fact that the Earth turns. And, just like with that, you are very free to compose in your mind the parallel reality in which you feel more comfortable.
 
Even my ADD disorder noticed that everything has been arranged to show all bars and colours giving the impression of a decreasing order.

Again, the Western world has fallen in such a sticky predicament, because even the self-proclaimed "critics" in all nations are just as muddled-headed and as unwilling to face the fact that disease and death is rambling wild in the healthy Western world, and that the choice of the governments can make about going out or staying home are actually the choice that their own peoples will actually make on their own and, most important, that there is no "golden middle" in which you will find more or less people dying or going bankrupt. It is the same silly contradiction that would pretend to gain capital growth with no real, with a "minimum" risk: if you do not take it, you will just have to find some sort of financial contraption to have others take it for you.

And pretend that you have nothing to do with it because, 1) the location of that risk is obviously far from your direct reach and responsibility and 2) you did not pull a gun against anyone to force a choice be made.
 
16-May-2020:

Global COVID-19 Mortality/Morbidity
- Global Cases reported: 4,574,902 (up from 4,477,351 / 2.2%) - *‬*97,551 new cases yesterday
- Global Deaths: 308,317 (up from 303,389) - **4,928 people died yesterday

US COVID-19 Mortality/Morbidity
- Cases reported in the US - 1,444,870 cases (up from 1,417,889 / 1.8% yesterday), ‬**25,007 new cases, 25.6% of world's new cases were in the US
- Yesterday's cases in NJ/NY - 4,042 (15.8%), outside NJ/NY - 21,466 (84.2%)
- Deaths reported in the US - 87,595 deaths, +1,692 deaths yesterday , 34.3% of the world's deaths yesterday were in the US
- Yesterday's Deaths in NJ/NY - 396 (22.4%), outside NJ/NY - 1,374 (77.6%)
- Testing: - 10,720,185 tests (up from 10,341,775 yesterday, +366,944 tests), 3.2% of the US population has been tested

NY state and NYC COVID-19 Mortality/Morbidity (as of 11AM yesterday)
- Cases reported in NY state - 345,813 (up from 343,051 / +2,762)
- Persons tested in NY state - 1,338,048 (up from 1,298,757 / +39,291)- 25.8% positive rate
- Cases reported in NYC - 187,848 (up from 186,293 / +1,555), hospitalized 49,580
- Deaths reported in NYC - 20,406 (up from 20,406 / +70), confirmed 15,422, suspected 5,054

Coronavirus cases/deaths in active countries (preference to countries with JUB members):
  • US - 1,444,870 (up from 1,419,863 / 1.8%) - 87,595 deaths / 250,747 recovered
  • Russia - 272,043 (up from 262,843 / 3.5%) - 2,537 deaths / 63,166 recovered
  • UK - 241,454 (up from 238,001 / 1.5%) - 34,546 deaths / 1,049 recovered
  • Brazil - 220,291 (up from 204,795 / 7.6%) - 15,046 deaths / 84,970 recovered
  • France - 179,630 (up from 178,994 / 0.4%) - 27,532 deaths / 60,562 recovered
  • Iran - 118,392 (up from 116,635 / 1.5%) - 6,937 deaths / 93,147 recovered
  • India - 86,595 (up from 83,072 / 4.2%) - 2,871 deaths / 34,224 recovered
  • Canada - 75,963 (up from 74,782 / 1.6%) - 5,792 deaths / 37,748 recovered
  • Mexico - 45,032 (up from 42,595 / 5.7%) - 4,767 deaths / 30,451 recovered
  • Netherlands - 44,069 (up from 43,880 / 0.4%) - 5,689 deaths / 159 recovered
  • Sweden - 29,677 (up from 29,207 / 1.6%) - 3,674 deaths / 4,971 recovered
Coronavirus cases/deaths in recovering countries:
  • Spain - 230,698 (up from 230,183 / 0.2%) - 27,563 deaths / 146,446 recovered
  • Italy - 223,885 (up from 223,096 / 0.4%) - 31,763 deaths / 122,810 recovered
  • Germany - 175,715 (up from 174,478 / 0.7%) - 7,938 deaths / 152,600 recovered
  • Turkey - 146,457 (up from 144,749 / 1.2%) - 4,096 deaths / 108,137 recovered
  • China - 84,038 (up from 84,031 / 0%) - 4,637 deaths / 79,282 recovered
  • Belgium - 54,989 (up from 54,644 / 0.6%) - 9,005 deaths / 14,460 recovered
  • Switzerland - 30,572 (up from 30,514 / 0.2%) - 1,879 deaths / 27,400 recovered
  • Ireland - 23,956 (up from 23,827 / 0.5%) - 1,518 deaths / 19,470 recovered
  • South Korea - 11,037 (up from 11,018 / 0.2%) - 262 deaths / 9,851 recovered
  • Japan - 16,203 (up from 16,120 / 0.5%) - 713 deaths / 10,338 recovered
  • Australia - 7,036 (up from 7,020 / 0.2%) - 98 deaths / 6,363 recovered
  • New Zealand - 1,498 (unchanged from 1,498 / 0%) - 21 deaths / 1,428 recovered
Canadian Province Stats:
  • Alberta - 6,515 (up from 6,457 / 0.9%) - 125 deaths
  • British Columbia - 2,407 (up from 2,392 / 0.6%) - 140 deaths
  • Manitoba - 289 (down from 289 / 0%) - 7 deaths
  • New Brunswick - 120 (unchanged from 120 / 0%) - 0 deaths
  • Newfoundland/Labrador - 260 (down from 261 / 0%) - 3 deaths
  • Northwest Territories - 5 (unchanged from 5 / 0%) - 0 deaths
  • Nova Scotia - 1,034 (up from 1,026 / 0.8%) - 55 deaths
  • Ontario - 23,262 (up from 22,866 / 1.7%) - 1,858 deaths
  • Quebec - 41,429 (up from 40,732 / 1.7%) - 3,401 deaths
  • Prince Edward Island - 27 (unchanged from 27 / 0%) - 0 deaths
  • Saskatchewan - 590 (up from 582 / 1.4%) - 6 deaths
  • Yukon - 11 (unchanged from 11 / 0%) - 0 deaths
 
...Again, the Western world has fallen in such a sticky predicament, because even the self-proclaimed "critics" in all nations are just as muddled-headed and as unwilling to face the fact that disease and death is rambling wild in the healthy Western world, and that the choice of the governments can make about going out or staying home are actually the choice that their own peoples will actually make on their own and, most important, that there is no "golden middle" in which you will find more or less people dying or going bankrupt...
In Dr. Bright's testimony, he called out the thing that is at the center of all the uncertainty in the US: there is no plan.

Normally, we would expect that the CDC and other governmental agencies would have a plan, they would execute the plan and then they would provide guidance to state and local officials who do most of the on-the-ground work.

Because there is no plan and the federal government is so dysfunctional, everyone is left to their own devices. There is no visible leadership from CDC. Attempts at leadership from the CDC are being tampered with by the White House.

One of the core tenets of public health science is that "a society is only as healthy as its sickest citizen". We have a minority in the US that have decided that they aren't going to listen to the scientists- either they believe it's all a hoax or they just don't care. The issue from a public health standpoint is that, as a long as the virus is allowed to circulate, the number of cases will continue to increase and that puts about 20% of our population at risk for acute disease and it puts 3-5% of our population at risk for dying.
 
this doctor think he got the virus through his eyes in the plane.
He did wear mask:

 
this doctor think he got the virus through his eyes in the plane.
He did wear mask:


It is well known that viruses can enter through the eyes....It is why health care workers wear goggles or eye shields as well as respiratory masks.
 
this doctor think he got the virus through his eyes in the plane.
He did wear mask:

I brought this up in the "mask" thread. My understanding, rightly or wrongly, has always been that the eyes are in fact the main entrance for infections like colds and flu--not because of people rubbing their eyes but directly from the airborne particles sneezed and coughed out by an infected person. But whenever this is mentioned in relation to coronavirus the experts just seem to shrug it off as possible but unlikely.
 
This is puzzling... the Navy has been pushing to get the USS Roosevelt back into the South China Sea after an outbreak of coronavirus on the ship last month. At that time, about 20% of the ship's complement of 5,000 people had tested positive.

Now, several sailors who had tested positive in March, but were assumed to now be negative, are testing positive again.

Eight sailors from USS Theodore Roosevelt who previously had coronavirus test positive again [CNN]
Eight additional sailors aboard the coronavirus-stricken carrier USS Theodore Roosevelt have now tested positive for the virus according to a defense official.

These eight sailors had previously tested positive and were removed from the ship in order to self-quarantine. They had all tested negative twice before being allowed back on board before this latest incident of testing positive again for the virus.

This latest development is in addition to five other sailors aboard the ship that CNN reported earlier this week who had also again tested positive after being thought to be clear of the virus.

The carrier is heavily screening crew members for reports of symptoms. Some of the now 13 sailors who have retested positive in fact had reportedd symptoms to the medical crew, the official said.
 
New Jersey and New York have started reporting some very detailed statistics on the COVID-19 cases in institutional and long term care. As of yesterday, New Jersey has 141,560 cases with 9,714 deaths.

New Jersey's dashboard breaks down cases in nursing homes, psychiatric facilities, etc.
  • Long Term Care Facilities: Number of facilities with cases: 525, positive Patients: 27,153 (5,168 deaths)
  • State Veterans Homes: positive Residents: 366 (137 deaths)
  • State Psychiatric Hospitals: positive Patients: 194 (12 deaths), positive Staff: 457 (5 deaths)

Long Term Care Facilities accounted for 19% of NJ's cases but were 53% of NJ's deaths.

From the way air flowed at the specialized nursing facility my mom was at for a while, the numbers from long-term care aren't surprising -- all it would take is the virus getting into the air intake and it would be everywhere in the facility.
 
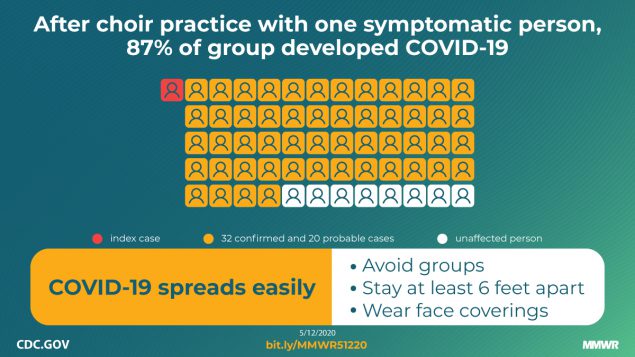
CDC's Morbidity and Mortality Weekly Report (MMWR) has a report about how a choir in Washington state had an outbreak of coronavirus.

61 singers, 1 of whom had "cold-like symptoms, attended two choir practices. Afterward, 52 attendees from the practices tested positive. 3 ended up in the hospital. 2 died.

mm6919e6_ChoirPracticeCOVID19_IMAGE_12May20_1200x675-medium.jpg


High SARS-CoV-2 Attack Rate Following Exposure at a Choir Practice — Skagit County, Washington, March 2020 [CDC]

Good grief -- what did they expect from having people crowded together and breathing in and out deeply? Having choir practice when someone has a virus is a guaranteed way to get people sick, I've seen it happen at several churches.

The only worse situation than choirs I've ever seen was a high school wrestling team where one guy had the flu; just about the entire varsity and JV teams ended up sick.
 
Check out the "progression" of the dates along the bottom of the county bar chart. Yeah! That's blatant manipulation.

Exactly. Unless the person looking at the chart is astute enough to notice that the dates are not in order, it's easy to assume that the deaths are decreasing daily.

The chart itself is something that a high school kid would get an "F" for. The top of the chart talks about "counties with most cases" but the chart says that the bar graph is "deaths and hospitalizations"? I only see 1 bar per county, so is this deaths? It is hospitalizations?

Also notice that the position of the county bars keeps changing in position, so that it's hard to follow the trends for any particular county. Fulton County (where Atlanta is located) is gold but sometimes it's in a different position on each day.

And why did they chose these 5 counties instead of presenting the state as a whole? For example, one of the worst hit counties in Georgia was Dougherty County- they have a population of about 88,000 but they have 1,626 cases and 128 deaths.

I agree with both of you, that particular chart is bad.

I would direct our attention back to the main issue I raised, however, that we don't seem to have robust information about, anymore:

How is Georgia doing, fourteen days after lifting its stay-at-home order? Or as one commentator described it, "human sacrifice"?

Is there a massive outbreak there that's being covered up by a network of public servants?

Here is the Georgia Department of Health website: https://dph.georgia.gov/covid-19-daily-status-report

It of course includes information from all Georgia's counties.
 
We will see whether what goes around comes around later this year. But it is always good to be reminded of the Spanish flu epidemic of 1918.

97636572_10159794450728327_4467669189397577728_n.jpg


Meanwhile...a case of two counties and two countries and what happens when policies in one province or state are not aligned with those in the other.

And this is between New York and Ontario, with NY's fairly aggressive testing and control.

Where medical workers were working on both sides of the border back in late March and early April, they had to choose one location on either side of the border and only work in that facility.

But even that doesn't prevent people with a high risk of exposure from transporting the virus back into their community if they are working in only one hospital in an area with more cases and less stringent controls


Niagara Region reported 12 new cases for the same period.

https://www.stcatharinesstandard.ca...krtpm1it2xmohztzxdzm_un3xojcruagpg2muso-oxvbg

This will be the same between US states and even within the States, between counties and between urban and rural areas. And of course, is also the same scenario for Europe and other countries.

Yep, half the cases in the county here can be traced directly to people from other counties, and others are likely to have been.

What's happening in Georgia?

On May 1st, the state lifted its stay-at-home order and subsequently received lots of criticism. Some of that predicted mayhem.

I've looked back on the data KaraBulut has been selflessly adding, but the last reports don't seem to show a sharp increase yet.

With a 2 to 14 day incubation period, it's still very early to tell what is happening, but this page isn't showing much disaster yet:

https://www.google.com/search?q=sta...6.69i57j0l7.9747j0j7&sourceid=chrome&ie=UTF-8

Here's Georgia's chart:

Cases__State_-_Georgia-Georgia_Reported_New_Cases_Per_Day-PowerRegression.png


The red line shows the expected result if no measure had been taken, the upper blue line is the worst-case expectation, and the lower blue line is what they need to stay below to get the virus under control.

It actually resembles quite a few states, where the trend is downward but the numbers bounce around a lot. A handful of states are doing better, notably Idaho--

Cases__State_-_Idaho-Idaho_Reported_New_Cases_Per_Day-PowerRegression.png


Montana--

Cases__State_-_Montana-Montana_Reported_New_Cases_Per_Day-PowerRegression.png


and Vermont--

Cases__State_-_Vermont-Vermont_Reported_New_Cases_Per_Day-PowerRegression.png


Here in Oregon there's talk of opening things up slightly, but the last week and a half of data aren't encouraging for that -- it was a steady downward trend until the 5th, but since then it's been heading up again--

Cases__State_-_Oregon-Oregon_Reported_New_Cases_Per_Day-PowerRegression.png


source: https://covid-19.mdmetrix.com/grid.html?list=new_case_curve
 
this doctor think he got the virus through his eyes in the plane.
He did wear mask:


Very popular video right now. Generating lots of views.

Headline: NBC's Dr. Joseph Fair hospitalized with coronavirus: 'Not out of the woods yet'

https://www.today.com/health/nbc-news-contributor-dr-joseph-fair-sick-coronavirus-t181487

From the bottom of the article:

He received four tests for COVID-19, all of which were negative, but doctors told him that they had no doubt that's what he had.

Fair said that a plausible explanation for his negative tests was that "the virus itself has passed out of my system, but my system is still responding to the damage that the virus did."

Four false negatives in a row, maybe?

Hmmmmm. Maybe?

he was admitted to Tulane Medical Center because of a bacterial lung infection, which caused his shortness of breath.

So maybe it was a bacterial lung infection? Can, like, doctors test for that?

Did he get a covid-19 antibody test?

Is it maybe just a little premature to chalk the illness up to covid-19?

I mean, the Today show wouldn't do a segment like this purely based on speculation just to attract viewers, right?
 
From the way air flowed at the specialized nursing facility my mom was at for a while, the numbers from long-term care aren't surprising -- all it would take is the virus getting into the air intake and it would be everywhere in the facility.
A few states have gotten it right- they're testing patients and staff and reporting on infections in both groups.

I suspect that there's not a single pattern of transmission that will account for what has happened in nursing homes but the general pattern is respiratory transmission, so the introduction of the virus either begins with an asymptomatic visitor or an asymptomatic staff member (or both) bringing the virus in from community acquisition.

The nature of nursing homes requires aggregation of patients in common areas and it also involves staff members in patient rooms delivering intimate care- both of which are the perfect mechanism for a respiratory virus to spread.

I brought this up in the "mask" thread. My understanding, rightly or wrongly, has always been that the eyes are in fact the main entrance for infections like colds and flu--not because of people rubbing their eyes but directly from the airborne particles sneezed and coughed out by an infected person. But whenever this is mentioned in relation to coronavirus the experts just seem to shrug it off as possible but unlikely.
Respiratory viruses are most efficiently transmitted by droplets. The nose and the mouth are the most common mechanism of entry.

I mentioned this in another post but if you think about how often you've stood next to someone and you've smelled bad breath, alcohol breath, coffee breath, smoker's breath, etc, then that will give you an idea of who easy it is for you to breath in air that was, moments before, in another person's lungs. If you can smell it, you're breathing in air that someone just exhaled.
 
I agree with both of you, that particular chart is bad.

I would direct our attention back to the main issue I raised, however, that we don't seem to have robust information about, anymore:

How is Georgia doing, fourteen days after lifting its stay-at-home order? Or as one commentator described it, "human sacrifice"?

Is there a massive outbreak there that's being covered up by a network of public servants?
Post #1183 has a chart that attempts to track the Georgia numbers. It's essentially flat but Georgia's reporting is erratic, I wouldn't make a judgment based upon three weeks of their data.

Even if we looks at a weekly 7 day average for daily case trending, there's really not enough trending to say there has been any change. Their cases peaked in the week ending 11-Apr at an average increase of 842 per day. The CDC guidelines indicated that reversal of quarantine measures could be considered after 14 consecutive days of decreasing cases which Georgia didn't meet before they reversed their stay-at-home order on 24-April. The prior two weeks had a decrease- down from 842 avg/day to 796 and 723 respectively. They have had ups and downs since going up to 749, down to 636 and up to 656. Because their test reporting is so erratic, it may take a week for their cases to be reported and we already know that the virus has an incubation period of up to 14 days.

Georgia's 7 day average daily cases for week ending:
  • 04-Apr - 538
  • 11-Apr - 842
  • 18-Apr - 796
  • 25-Apr - 723 (quarantine order reversed 24-Apr)
  • 02-May - 749
  • 09-May - 636
  • 16-May - 656

Bottom line on Georgia: Too early to know.

Other states like Texas, California and Nebraska might make better studies since they provide different levels of relaxing of control measures.

Texas, in particular, is interesting. Daily cases have increased - jumping from 1,000 to 1,400 over the past couple of weeks. Texas relaxed their quarantine order at a time when their cases were increasing.

There's really two epidemics going on in Texas- one urban and the other rural. The urban epidemic in Texas has a big driver: the incarcerated. The rural epidemic has another nexus: meat packing plants. The counties with highest per capita case loads in Texas usually have meat packing plants.

Examples:
Moore County- 544 cases, population-20,940, case rate is 26 per 1,000
Potter County- 2,129 cases, population-117,415, case rate is 18.1 per 1,000
Dallas County - 7,250 cases, population-2.6 million, case rate is 2.7 per 1,000
Harris County - 9,126 cases, population-4.7 million, case rate is 1.9 per 1,000

Texas' 7 day average daily cases for week ending:
  • 04-Apr - 614
  • 11-Apr - 910
  • 18-Apr - 812
  • 25-Apr - 795
  • 02-May - 899 (quarantine order expired 1-May)
  • 09-May - 1,043
  • 16-May - 1,233

Verdict on Texas: Too early to know.
 
17-May-2020:

Global COVID-19 Mortality/Morbidity
- Global Cases reported: 4,662,534 (up from 4,574,902 / 2.2%) - *‬*89,584 new cases yesterday
- Global Deaths: 312,274 (up from 308,317) - **4,928 people died yesterday

US COVID-19 Mortality/Morbidity
- Cases reported in the US - 1,468,577 cases (up from 1,444,870 / % yesterday), ‬**23,707 new cases, 26.4% of world's new cases were in the US
- Yesterday's cases in NJ/NY - 3,524 (14.4%), outside NJ/NY - 20,963 (85.6%)
- Deaths reported in the US - 88,898 deaths, +1,303 deaths yesterday , 1.5% of the world's deaths yesterday were in the US
- Yesterday's Deaths in NJ/NY - 284 (23.9%), outside NJ/NY - 902 (76.1%)
- Testing: - 11,077,179 tests (up from 10,720,185 yesterday, +356,994 tests), 3.4% of the US population has been tested

NY state and NYC COVID-19 Mortality/Morbidity (as of 11AM yesterday)
- Cases reported in NY state - 348,232 (up from 345,813 / +2,419)
- Persons tested in NY state - 1,378,717 (up from 1,338,048 / +40,669)- 25.2% positive rate
- Cases reported in NYC - 189,031 (up from 187,848 / +1,183), hospitalized 49,969
- Deaths reported in NYC - 20,576 (up from 20,406 / +100), confirmed 15,756, suspected 4,820

Coronavirus cases/deaths in active countries (preference to countries with JUB members):
  • US - 1,470,199 (up from 1,444,870 / 1.8%) - 88,898 deaths / 268,376 recovered
  • Russia - 281,752 (up from 272,043 / 3.7%) - 2,631 deaths / 67,373 recovered
  • UK - 241,461 (unchanged from 241,454 / 0%) - 34,546 deaths / 1,058 recovered (no update)
  • Brazil - 233,511 (up from 220,291 / 6.5%) - 15,668 deaths / 89,672 recovered
  • France - 179,630 (unchanged from 179,630 / 0%) - 27,532 deaths / 60,562 recovered (no update)
  • Iran - 120,198 (up from 118,392 / 1.5%) - 6,988 deaths / 94,464 recovered
  • India - 91,449 (up from 86,595 / 5.8%) - 2,911 deaths / 35,603 recovered
  • Canada - 77,206 (up from 75,963 / 1.7%) - 5,803 deaths / 38,172 recovered
  • Mexico - 47,144 (up from 45,032 / 5.0%) - 5,045 deaths / 31,848 recovered
  • Netherlands - 44,195 (up from 44,069 / 0.3%) - 5,699 deaths / 167 recovered
  • Sweden - 30,143 (up from 29,677 / 1.6%) - 3,679 deaths / 4,971 recovered
Coronavirus cases/deaths in recovering countries:
  • Spain - 230,698 (up from 230,698 / 0%) - 27,563 deaths / 146,446 recovered (no update)
  • Italy - 224,760 (up from 223,885 / 0.4%) - 31,908 deaths / 125,176 recovered
  • Germany - 176,369 (up from 175,715 / 0.4%) - 7,958 deaths / 154,011 recovered
  • Turkey - 148,067 (up from 146,457 / 1.1%) - 4,096 deaths / 108,137 recovered
  • China - 84,047 (up from 84,038 / 0.0%) - 4,638 deaths / 84,047 recovered
  • Belgium - 55,280 (up from 54,989 / 0.5%) - 9,052 deaths / 14,630 recovered
  • Switzerland - 30,587 (up from 30,572 / 0%) - 1,881 deaths / 27,400 recovered
  • Ireland - 24,048 (up from 23,956 / 0.4%) - 1,533 deaths / 19,470 recovered
  • South Korea - 11,050 (up from 11,037 / 0.1%) - 262 deaths / 9,888 recovered
  • Japan - 16,237 (up from 16,203 / 0.2%) - 725 deaths / 10,338 recovered
  • Australia - 7,045 (up from 7,036 / 0.1%) - 98 deaths / 6,367 recovered
  • New Zealand - 1,499 (unchanged from 1,498 / 0.1%) - 21 deaths / 1,433 recovered
Canadian Province Stats:
  • Alberta - 6,587 (up from 6,515 / 1.1%) - 126 deaths
  • British Columbia - 2,482 (up from 2,407 / 3.1%) - 141 deaths
  • Manitoba - 289 (down from 289 / 0%) - 7 deaths
  • New Brunswick - 120 (unchanged from 120 / 0%) - 0 deaths
  • Newfoundland/Labrador - 260 (down from 260 / 0%) - 3 deaths
  • Northwest Territories - 5 (unchanged from 5 / 0%) - 0 deaths
  • Nova Scotia - 1,037 (up from 1,034 / 0.3%) - 55 deaths
  • Ontario - 23,772 (up from 23,262 / 2.2%) - 1,881 deaths
  • Quebec - 42,192 (up from 41,429 / 1.8%) - 3,483 deaths
  • Prince Edward Island - 27 (unchanged from 27 / 0%) - 0 deaths
  • Saskatchewan - 591 (up from 590 / 0.2%) - 6 deaths
  • Yukon - 11 (unchanged from 11 / 0%) - 0 deaths
 
We're at the point where people are saying, "If you think the US is bad, look at Russia!".

Russia's healthcare system in its major cities has been upgraded since the failure of the USSR but it has not kept up with Western standards. Hospitals and clinics in rural areas have not improved greatly from their dismal state during the communist era. As the virus spreads into the rural areas of Russia, the deaths will grow exponentially. Russia is currently lying about the number of deaths in their country, so we may never know how many thousands of people have contracted the virus in Russia and how many have died.


Coronavirus has devastated Moscow. Now it's spreading across Russia's 11 time zones to ill-funded regions [CNN]
Russia hit a grim Covid-19 milestone this week: According to Johns Hopkins University, the country now ranks second in the world for confirmed coronavirus cases.

The Russian capital has been hardest hit. Of Russia's total of 281,752 confirmed cases, over half -- 142,824 -- are in Moscow, the country's coronavirus headquarters said Sunday. But the virus is now spreading across Russia's regions, an enormous landmass that covers 11 time zones and includes some of the country's most remote and impoverished places.

In a video conference meeting on Monday with Russia's 85 regional heads, Russian President Vladimir Putin said the burden would fall to local leaders to decide whether to continue lockdown measures or to begin cautiously lifting restrictions to reopen the economy.
 
^ You mean we are at the point where people are not saying "look at Russia, they had it all under control without any lockdown" anymore.
 
Back
Top