The Original Gay Porn Community - Free Gay Movies and Photos, Gay Porn Site Reviews and Adult Gay Forums

  • Welcome To Just Us Boys - The World's Largest Gay Message Board Community

    In order to comply with recent US Supreme Court rulings regarding adult content, we will be making changes in the future to require that you log into your account to view adult content on the site.
    If you do not have an account, please register.
    REGISTER HERE - 100% FREE / We Will Never Sell Your Info

    To register, turn off your VPN; you can re-enable the VPN after registration. You must maintain an active email address on your account: disposable email addresses cannot be used to register.

  • Hi Guest - Did you know?
    Hot Topics is a Safe for Work (SFW) forum.

On Topic Discussion 2019 Coronavirus (COVID-19/SARS-CoV-2)

Some data from Italy, here, just one place and everywhere is different:

https://www.epicentro.iss.it/en/coronavirus/bollettino/Report-COVID-2019_7_may_2020.pdf

.2% of all deaths were in people under 40.

Around 60% of mortalities involved patients with three or more co-morbidities.

3% showed no co-morbidities.

Median age of death was 81.

It's little different from the reporting we're getting from other areas- the reporting that I saw divided the deaths into <65 yo (~25%), 65-75 (~25%) and >75 (~50%).

The comorbidity information would have been of more value if they would have broken it down by age group. It's rare to find people in the >50 year old age group who don't have a comorbidity, especially since hypertension and diabetes were the top ranked comorbidities.
 
New Jersey and New York have started reporting some very detailed statistics on the COVID-19 cases in institutional and long term care. As of yesterday, New Jersey has 141,560 cases with 9,714 deaths.

New Jersey's dashboard breaks down cases in nursing homes, psychiatric facilities, etc.
  • Long Term Care Facilities: Number of facilities with cases: 525, positive Patients: 27,153 (5,168 deaths)
  • State Veterans Homes: positive Residents: 366 (137 deaths)
  • State Psychiatric Hospitals: positive Patients: 194 (12 deaths), positive Staff: 457 (5 deaths)

Long Term Care Facilities accounted for 19% of NJ's cases but were 53% of NJ's deaths.
 
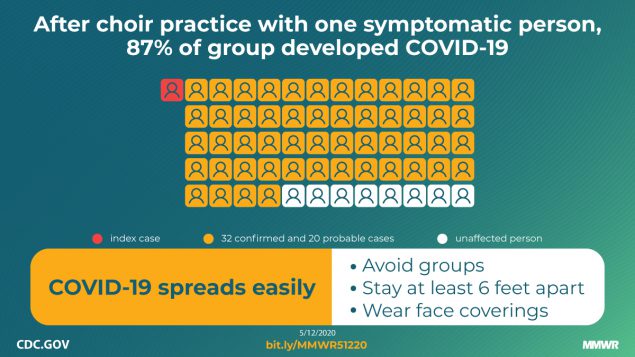
CDC's Morbidity and Mortality Weekly Report (MMWR) has a report about how a choir in Washington state had an outbreak of coronavirus.

61 singers, 1 of whom had "cold-like symptoms, attended two choir practices. Afterward, 52 attendees from the practices tested positive. 3 ended up in the hospital. 2 died.

mm6919e6_ChoirPracticeCOVID19_IMAGE_12May20_1200x675-medium.jpg


High SARS-CoV-2 Attack Rate Following Exposure at a Choir Practice — Skagit County, Washington, March 2020 [CDC]
Following a 2.5-hour choir practice attended by 61 persons, including a symptomatic index patient, 32 confirmed and 20 probable secondary COVID-19 cases occurred (attack rate = 53.3% to 86.7%); three patients were hospitalized, and two died. Transmission was likely facilitated by close proximity (within 6 feet) during practice and augmented by the act of singing.
 
CDC's Morbidity and Mortality Weekly Report (MMWR) has a report about how a choir in Washington state had an outbreak of coronavirus.

61 singers, 1 of whom had "cold-like symptoms, attended two choir practices. Afterward, 52 attendees from the practices tested positive. 3 ended up in the hospital. 2 died.

mm6919e6_ChoirPracticeCOVID19_IMAGE_12May20_1200x675-medium.jpg


High SARS-CoV-2 Attack Rate Following Exposure at a Choir Practice — Skagit County, Washington, March 2020 [CDC]

Makes sense:

The 2.5-hour singing practice provided several opportunities for droplet and fomite transmission, including members sitting close to one another, sharing snacks, and stacking chairs at the end of the practice. The act of singing, itself, might have contributed to transmission through emission of aerosols, which is affected by loudness of vocalization (1)

The median age of the attendees was 69, as was the median age of those who became ill. The case was probably so identifiable because the median age was over 65. A large group of young and healthy people might not have developed the symptoms and death that would become a noticeable phenomenon.
 
It's little different from the reporting we're getting from other areas- the reporting that I saw divided the deaths into <65 yo (~25%), 65-75 (~25%) and >75 (~50%).

The comorbidity information would have been of more value if they would have broken it down by age group. It's rare to find people in the >50 year old age group who don't have a comorbidity, especially since hypertension and diabetes were the top ranked comorbidities.

(My bolding). I hate to be optimistic, but I take this as relatively good news.
 
And now that the political shenanigans have (mostly) been put to rest regarding this pharmaceutical, it appears science can continue a neutral, measured analysis of its possible uses:

https://www.nih.gov/news-events/new...ydroxychloroquine-azithromycin-treat-covid-19

“We urgently need a safe and effective treatment for COVID-19. Repurposing existing drugs is an attractive option because these medications have undergone extensive testing, allowing them to move quickly into clinical trials and accelerating their potential approval for COVID-19 treatment,” said NIAID Director Anthony S. Fauci, M.D. “Although there is anecdotal evidence that REDACTED may benefit people with COVID-19, we need solid data from a large randomized, controlled clinical trial to determine whether this experimental treatment is safe and can improve clinical outcomes.”
 
Today's stats will report 10,341,775 tests done in the US- about 3.1% of the US population. Note: this is a statistic of the number of tests, not the number of people tested.

Usually when any person is tested for coronavirus, if they are positive, they can be expected to be tested 1-2 more times to confirm that the test was not a false positive or, if they have recovered, they no longer have the virus. Several states have mandated weekly testing of nursing home patients and it's unclear whether each test is being counted in the number reported.

Here's the breakdown for the top 10 states for the number of tests and the percentage of each state contributed to the 10 million total tested):
  1. New York - 1,298,757 (12.6%)
  2. California - 1,104,651 (10.7%)
  3. Texas - 623,284 (6.0%)
  4. Florida - 608,837 (5.9%)
  5. Illinois - 512,037 (5.0%)
  6. New Jersey - 451,696 (4.4%)
  7. Massachusetts - 410,032 (4.0%)
  8. Michigan - 335,883 (3.2%)
  9. Pennsylvania - 311,195 (3.0%)
  10. Tennessee - 302,317 (2.9%)
 
We will see whether what goes around comes around later this year. But it is always good to be reminded of the Spanish flu epidemic of 1918.

97636572_10159794450728327_4467669189397577728_n.jpg


Meanwhile...a case of two counties and two countries and what happens when policies in one province or state are not aligned with those in the other.

And this is between New York and Ontario, with NY's fairly aggressive testing and control.

Where medical workers were working on both sides of the border back in late March and early April, they had to choose one location on either side of the border and only work in that facility.

But even that doesn't prevent people with a high risk of exposure from transporting the virus back into their community if they are working in only one hospital in an area with more cases and less stringent controls

Hirji said Erie County (NY) had 95 new cases this week, while Niagara County (NY) had 16. About 18 per cent of those tested in the counties have the virus, he said. In Niagara Region (ON) that figure is between three per cent and four per cent.

Niagara Region reported 12 new cases for the same period.

https://www.stcatharinesstandard.ca...krtpm1it2xmohztzxdzm_un3xojcruagpg2muso-oxvbg

This will be the same between US states and even within the States, between counties and between urban and rural areas. And of course, is also the same scenario for Europe and other countries.
 
^ Does that mean that we will be having the second wave during the summer, by the end of June, and through July, August and September?
 
15-May-2020:

Global COVID-19 Mortality/Morbidity
- Global Cases reported: 4,477,351 (up from 4,371,611 / %) - *‬*105,740 new cases yesterday
- Global Deaths: 303,389 (up from 297,682) - **5,707 people died yesterday

US COVID-19 Mortality/Morbidity
- Cases reported in the US - 1,417,889 cases (up from 1,390,764 / 2.0% yesterday), ‬**27,125 new cases, 25.6% of world's new cases were in the US
- Yesterday's cases in NJ/NY - 3,534 (13.0%), outside NJ/NY - 23,591 (87.0%)
- Deaths reported in the US - 85,903 deaths, +1,770 deaths yesterday , 31% of the world's deaths yesterday were in the US
- Yesterday's Deaths in NJ/NY - 396 (22.4%), outside NJ/NY - 1,374 (77.6%)
- Testing: - 10,341,775 tests (up from 9,974,831 yesterday, +366,944 tests), 3.1% of the US population has been tested

NY state and NYC COVID-19 Mortality/Morbidity (as of 11AM yesterday)
- Cases reported in NY state - 343,051 (up from 340,661 / +2,390)
- Persons tested in NY state - 1,298,757 (up from 1,258,907 / +39,850)- 26.4% positive rate
- Cases reported in NYC - 186,293 (up from 185,206 / +1,087), hospitalized 49,516
- Deaths reported in NYC - 20,406 (up from 20,316 / +90), confirmed 15,349, suspected 5,057


Coronavirus cases/deaths in active countries (preference to countries with JUB members):
  • US - 1,419,863 (up from 1,390,764 / 2.1%) - 85,903 deaths / 246,414 recovered
  • Russia - 262,843 (up from 252,245 / 4.2%) - 2,418 deaths / 58,226 recovered
  • UK - 238,001 (up from 234,431 / 1.5%) - 34,077 deaths / 1,045 recovered
  • France - 178,994 (up from 178,184 / 0.5%) - 27,428 deaths / 59,719 recovered
  • Brazil - 204,795 (up from 190,137 / 7.7%) - 14,131 deaths / 79,479 recovered
  • Iran - 116,635 (up from 114,533 / 1.8%) - 6,902 deaths / 91,836 recovered
  • India - 83,072 (up from 78,810 /[ 5.4%) - 2,662 deaths / 28,792 recovered
  • Canada - 74,782 (up from 73,568 / 1.7%) - 5,592 deaths / 36,541 recovered
  • Netherlands - 43,880 (up from 43,680 / 0.5%) - 5,662 deaths / 159 recovered
  • Mexico - 42,595 (up from 40,186 / 6.0%) - 5,662 deaths / 28,475 recovered
  • Sweden - 29,207 (up from 28,582 / 2.2%) - 3,646 deaths / 4,971 recovered/
Coronavirus cases/deaths in recovering countries:
  • Spain - 230,183 (up from 228,691 / 0.7%) - 27,459 deaths / 144,783 recovered
  • Italy - 223,096 (up from 222,104 / 0.4%) - 31,368 deaths / 115,288 recovered
  • Germany - 174,478 (up from 174,098 / 0.2%) - 7,884 deaths / 151,547 recovered
  • Turkey - 144,749 (up from 143,114 / 1.1%) - 4,007 deaths / 104,030 recovered
  • China - 84,031 (up from 84,025 / 0%) - 4,637 deaths / 79,273 recovered
  • Belgium - 54,644 (up from 54,288 / 0.7%) - 8,959 deaths / 14,301 recovered
  • Switzerland - 30,514 (up from 30,463 / 0.2%) - 1,874 deaths / 27,100 recovered
  • Ireland - 23,827 (up from 23,401 / 1.8%) - 1,506 deaths / 19,470 recovered
  • South Korea - 11,018 (up from 10,991 / 0.2%) - 260 deaths / 9,821 recovered
  • Japan - 16,120 (up from 16,049 / 0.4%) - 697 deaths / 9,868 recovered
  • Australia - 7,020 (up from 6,989 / 0.4%) - 98 deaths / 6,338 recovered
  • New Zealand - 1,498 (unchanged from 1,497 / 0.1%) - 21 deaths / 1,421 recovered
Canadian Province Stats:
  • Alberta - 6,457 (up from 6,407 / 0.8%) - 121 deaths
  • British Columbia - 2,392 (up from 2,376 / 0.7%) - 135 deaths
  • Manitoba - 289 (down from 290 / 0%) - 7 deaths
  • New Brunswick - 120 (unchanged from 120 / 0%) - 0 deaths
  • Newfoundland/Labrador - 261 (unchanged from 261 / 0%) - 3 deaths
  • Northwest Territories - 5 (unchanged from 5 / 0%) - 0 deaths
  • Nova Scotia - 1,026 (up from 1,024 / 0.2%) - 51 deaths
  • Ontario - 22,866 (up from 22,516 / 1.6%) - 1,825 deaths
  • Quebec - 40,732 (up from 39,940 / 2.0%) - 3,351 deaths
  • Prince Edward Island - 27 (unchanged from 27 / 0%) - 0 deaths
  • Saskatchewan - 582 (up from 577 / 0.9%) - 6 deaths
  • Yukon - 11 (unchanged from 11 / 0%) - 0 deaths
 
What's happening in Georgia?

On May 1st, the state lifted its stay-at-home order and subsequently received lots of criticism. Some of that predicted mayhem.

I've looked back on the data KaraBulut has been selflessly adding, but the last reports don't seem to show a sharp increase yet.

With a 2 to 14 day incubation period, it's still very early to tell what is happening, but this page isn't showing much disaster yet:

https://www.google.com/search?q=sta...6.69i57j0l7.9747j0j7&sourceid=chrome&ie=UTF-8

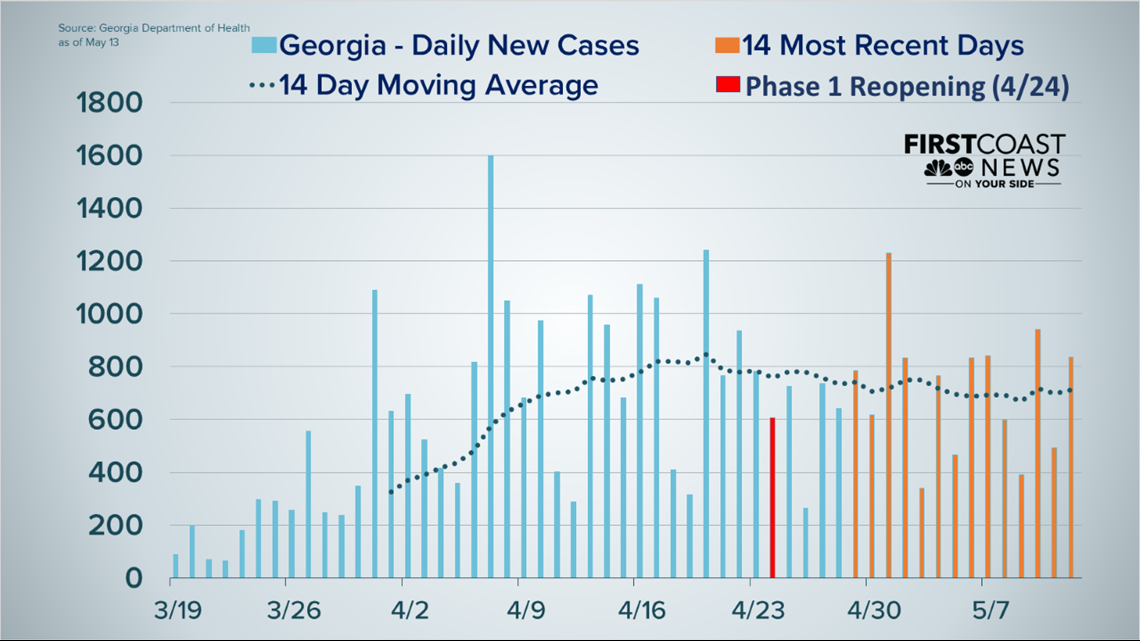
I'm a little hesitant to make any comment on Georgia. One day, the state reports 1,200 new cases. The next day, they report 150 cases. Then they report another 1,200 cases. They've been backdating tests which shifts cases backwards in time. They changed maps midstream to increase the threshold at which counties with high cases changed from blue to red, so one day a county was in red and then the next the same county was blue. There was at least one day where they reported a number confirmed positives that was greater than the number of tests that they had run. :telstra:

And then they put out charts like this one (which seems to have been created by an art student with no understanding of how to prepare a bar chart?):

EXr1NZGX0AYrXkL


As best I can tell from efforts to standardize their data, they seem to be flat... but who knows what is actually happening?
8fde37a7-87b4-445c-8832-af3ea683f384_1140x641.png
 
^It is a confounding situation. It seems like earlier on, we treated the data out of Georgia as a reasonable measure of what was actually happening and a reliable basis for policy. Now, the data may no longer be regarded as a decent measure of the same.

Is Georgia deliberately mis-representing the numbers to make its policies appear sound?

Are critics skeptical of the numbers because they're skeptical of Georgia's policies?

Is Georgia just all around incompetent?

Is it too early to really say?

Indeed, who knows what is actually happening?

Despite the end of the stay at home order, hopefully Georgians are still being vigilant with the basics: distancing, clean hands, masks, etc.
 
Check out the "progression" of the dates along the bottom of the county bar chart. Yeah! That's blatant manipulation.
 
^It's very troubling that the facts themselves seem to be in question. Whoever is collecting and reporting the data has an elementary obligation to record the facts as plainly and accurately as they can.

We have previously relied on the state of Georgia to provide us with a picture of what is actually happening in order to create and sustain policy.

If we can no longer do that, policy will be created out of speculation, fiat, fantasy and fear, and the beneficiaries of that policy will not be you and I.
 
That graphic might represent what the epidemic would be like in most of the USA, and many parts of the world, if the virus' spreading had been kept away from the dense main urban areas of the Western world: a sort of roller coaster with no definite direction towards worsening or improving, that would be watched in Milan, Madrid, Barcelona, NYC, LA, Paris, London and Tokyo as one piece of sensational news that would get boring and inconsequential to the lives of the watchers after a couple of days.
 
Check out the "progression" of the dates along the bottom of the county bar chart. Yeah! That's blatant manipulation.
Exactly. Unless the person looking at the chart is astute enough to notice that the dates are not in order, it's easy to assume that the deaths are decreasing daily.

The chart itself is something that a high school kid would get an "F" for. The top of the chart talks about "counties with most cases" but the chart says that the bar graph is "deaths and hospitalizations"? I only see 1 bar per county, so is this deaths? It is hospitalizations?

Also notice that the position of the county bars keeps changing in position, so that it's hard to follow the trends for any particular county. Fulton County (where Atlanta is located) is gold but sometimes it's in a different position on each day.

And why did they chose these 5 counties instead of presenting the state as a whole? For example, one of the worst hit counties in Georgia was Dougherty County- they have a population of about 88,000 but they have 1,626 cases and 128 deaths.


^It is a confounding situation. It seems like earlier on, we treated the data out of Georgia as a reasonable measure of what was actually happening and a reliable basis for policy. Now, the data may no longer be regarded as a decent measure of the same.

Is Georgia deliberately mis-representing the numbers to make its policies appear sound?

Are critics skeptical of the numbers because they're skeptical of Georgia's policies?

Is Georgia just all around incompetent?

Is it too early to really say?

Indeed, who knows what is actually happening?

Despite the end of the stay at home order, hopefully Georgians are still being vigilant with the basics: distancing, clean hands, masks, etc.

In cases like this, sometimes it's not the answers that matter but it matters more that we're having to ask them.

If you read any epidemiology textbook, you come away with a feeling that the Americans have always been in the lead in the field. Sometimes the Americans have smashing successes- like with campaigns to eradicate tuberculosis, yellow fever, polio and smallpox. Other times, it's a mixed bag- like with malaria or the 1976 Swine Flu campaign. Regardless of whether the campaign was successful or mixed, the methodology and the interventions by the CDC and NIH were sound and their methodologies have become the gold standard in epidemiology world-wide. Anytime there's a new emerging disease like Ebola, it's the WHO and the CDC that the world looks to for their expertise.

Until now. The problem with having a group of people in charge who don't believe in government or in science is that their efforts to undermine government and science become a self-fulfilling prophecy. I can't answer your questions because there are people in charge that have undermined the scientists to the point that we can't tell whether it's incompetence or malfeasance that is to blame.
 
^ I'm convinced it's Incompetence COMBINED WITH Malfeasance! "If you don't test, you won't have any cases." _ D.J.T. (Derelict Juvenile Tantrum)
 
Back
Top